
Core Web Vitals are Google's three field-measured metrics for loading (LCP), responsiveness (INP), and visual stability (CLS), with good thresholds of 2.5 seconds, 200 milliseconds, and 0.1, respectively.
Why can a website look fast in a performance test yet feel sluggish on someone's phone? Because a controlled test doesn't necessarily reproduce the device, connection, scripts, or interactions that visitor experiences.
For WordPress owners, understanding what Core Web Vitals are means separating three different problems: waiting for content, waiting for a response, and losing your place when content moves. That distinction helps you fix the right thing instead of installing another optimization plugin and hoping.
Table of Contents
- Core Web Vitals Thresholds at a Glance
- Three Metrics Explained Through Everyday Analogies
- How Google Scores Your Page at the 75th Percentile
- Why Lab Scores and Real Visitors Disagree
- Measure Core Web Vitals With the Right Tools
- How Most Websites Perform on Each Metric Today
- How to Fix LCP, INP and CLS on a WordPress Site
- Check Each Template Against All Three Thresholds
Core Web Vitals Thresholds at a Glance
Core Web Vitals measure the experience of using a page, not just how quickly its files download. They also form part of Google's evaluation of page experience in search, with their introduction and subsequent use as a ranking signal described in the HTTP Archive performance chapter.
Each metric has a good, needs-improvement, and poor band. The Google threshold guidance defines the boundaries used in this table.
| Metric | What it measures | Good | Needs improvement | Poor |
|---|---|---|---|---|
| LCP (Largest Contentful Paint) | Loading: time until the largest visible element renders | 2.5 seconds or less | Above 2.5 to 4.0 seconds | Over 4.0 seconds |
| INP (Interaction to Next Paint) | Responsiveness: delay from a tap, click, or key press to the visual response | 200 milliseconds or less | Over 200 to 500 milliseconds | Over 500 milliseconds |
| CLS (Cumulative Layout Shift) | Visual stability: unexpected movement of page content | 0.1 or less | Over 0.1 to 0.25 | Over 0.25 |
A page receives a good assessment only when all three metrics pass at the 75th percentile of measured visits, under Google's threshold framework. An excellent loading result can't cancel out an unresponsive menu or shifting article text.
Read the bands as diagnostic clues
An LCP problem points toward delivery and rendering of the main visible content. An INP problem points toward work that delays interaction feedback, while a CLS problem points toward unstable layout.
INP replaced First Input Delay, usually abbreviated FID, as the responsiveness metric. If an older tutorial tells you to optimize only FID, it doesn't describe the current assessment.
Start by opening Google Search Console or PageSpeed Insights. Record the band for each metric on your main article template, rather than copying only the overall performance score.
Three Metrics Explained Through Everyday Analogies
LCP is waiting for the main dish
At a restaurant, receiving a glass of water doesn't mean your meal has arrived. Similarly, a page can display its background and logo while visitors are still waiting for the largest visible article image or text block.
The restaurant comparison helps distinguish an early sign of activity from delivery of the main content.

Say a WordPress article displays its navigation immediately, but its featured image arrives much later. Visitors see that something is happening, yet LCP remains concerned with the largest visible content, not the first small item that appeared.
A delayed web font can also hold up a prominent heading. The useful question isn't whether anything appeared, but whether the content visitors came to read became available promptly.
INP is pressing a light switch
You press a switch and expect the room to respond. If nothing happens immediately, you may press again, even if the electrical system eventually does what you asked.
A mobile navigation button creates the same expectation. If a plugin script occupies the browser when someone taps, the menu may remain closed until the browser can handle the interaction and paint its response.
INP concerns interactions throughout the visit, not just the first button someone presses. A page can feel responsive at arrival and become frustrating when a visitor opens search or submits a comment.
CLS is reading a moving menu
You're reading a menu when someone slides another sheet underneath it, moving every line. On a website, that can happen when a cookie banner inserts itself above an article or an image expands into space the browser hadn't reserved.
CLS is a unitless stability score, not another loading duration. Making an advertisement arrive faster doesn't reliably prevent movement if its container still has no reserved size.
Show the main content quickly, respond to the visitor immediately, and stay still while loading.
Match the symptom before choosing a fix: a late featured image suggests LCP, a reluctant menu suggests INP, and a paragraph that jumps beneath your finger suggests CLS.
How Google Scores Your Page at the 75th Percentile
A performance result from your own laptop isn't a measurement of everyone else's experience. Google's Web Vitals overview explains that assessment uses the 75th percentile of real page views, with mobile and desktop evaluated separately.
Think of the percentile as a position in an ordered list, not an average. Arrange measured experiences from fastest to slowest and look toward the point that includes three-quarters of them.
A hypothetical visit distribution
Suppose an article receives 1,000 measured visits. In a simplified illustration of the percentile calculation, you'd inspect the 750th-fastest LCP experience, rather than averaging all the loading times.
That example is arithmetic, not a claim about typical traffic. Its practical meaning is that a collection of extremely fast visits can't hide a substantial slow group as easily as it might in an average.
| Question | Why it matters |
|---|---|
| Are phone visitors struggling? | Desktop results don't establish mobile performance. |
| Does the issue affect article pages? | A shared template may create the same problem across many posts. |
| Which metric fails? | The repair depends on whether loading, responsiveness, or stability is weak. |
The all-metrics requirement also applies independently. Improving image delivery doesn't settle an interaction problem, even if the page feels much quicker when you reload it yourself.
Search Console groups similar URLs, which helps you identify shared problems instead of treating every post as an unrelated failure. Those groups often correspond to common layouts, but don't assume they map perfectly to your WordPress template names.
Open the mobile Core Web Vitals report first. Write down the failing group, its representative URLs, and its failing metric so you have a defined repair target.
Why Lab Scores and Real Visitors Disagree
The common assumption is that a strong Lighthouse score proves a website is fast. It proves something narrower: the tested page performed well under that test's conditions.
Google's explanation of lab and field data differences distinguishes controlled measurements from actual visitor experiences. Both can be correct even when they appear to disagree.
A lab test uses a chosen device and network profile. Real visitors arrive with different phones, connections, locations, cached resources, consent choices, and personalized content.
Turn disagreement into a diagnosis
A clean test may never encounter the advertising combination that slows a reader's phone. It may also finish before a late embed appears, or never perform the search interaction that visitors find frustrating.
Use this sequence rather than arguing with the score:
- Identify the affected URL group. Check whether the problem concerns posts, archives, product pages, or another shared layout.
- Find the failing metric and audience. Start with mobile versus desktop, then use your own monitoring to investigate country or returning-visitor differences.
- Reproduce the condition. Test a representative page with a comparable device profile, a slower connection, and the relevant consent or advertising state.
- Apply the fix and monitor field results. New visits need to enter the reporting dataset before the aggregate reflects the changed experience.
Don't reverse an otherwise successful repair because the field report hasn't moved immediately. Confirm the technical change in a controlled test, document its release, and watch whether subsequent visitor measurements improve.
Practical rule: Use lab data to explain a failure. Use field data to decide whether visitors are receiving a good experience.
A strong lab score is useful evidence, but it isn't proof of success until field measurements support it.
Measure Core Web Vitals With the Right Tools
Choose the tool according to your question. Search Console finds affected groups, PageSpeed Insights investigates a URL, and developer tools help explain what the browser was doing.
| Tool | Data type | What it gives you | Best use |
|---|---|---|---|
| Google Search Console Core Web Vitals report | Field | Similar URL groups, often sharing templates, separated into mobile and desktop | Finding failing page groups |
| PageSpeed Insights | Field and lab | Available real-user data plus a Lighthouse run for one URL | Quickly checking a single page |
| Lighthouse | Lab | Simulated loading under configured conditions | Reproducing and diagnosing a failure |
| Chrome User Experience Report | Field | Public real-user dataset behind many tools | Comparing your site with others |
| web-vitals JavaScript library | Field | Records LCP, INP, and CLS from your visitors | Segmenting by page type, device, and country |
Field data is the weather your visitors encountered; lab data is a forecast run under the conditions you selected. The distinction matters when a page passes a Lighthouse check yet real phone users still wait. PageSpeed Insights can show both, so read the labels carefully. Check whether its field assessment represents the particular URL or the wider origin. If field data is insufficient, an available Lighthouse result does not substitute for a real-user assessment.
If the field report splits mobile and desktop, start with mobile. Phone visitors face less forgiving loading conditions, and LCP often exposes that gap before interaction metrics do. Use the web-vitals library when you need to separate templates, devices, or countries, since Search Console groups pages that may not share the same weakness.
Run Lighthouse in Chrome DevTools or from the command line when testing a repair. For interaction problems, also record a Performance trace while opening navigation, using search, or dismissing a dialog. The trace shows the tasks competing for the main thread, which a single INP number cannot explain. Keep that investigative work separate from asset preparation. If a trace points to a large hero image, a free online image compressor can produce a smaller test file, but rerun the same measurement before treating the image as the cause.
A dashboard starts the investigation. Confirm which audience is failing, reproduce the condition, and compare the new field results after the fix reaches visitors.
How Most Websites Perform on Each Metric Today
A page can look healthy in a lab test and still disappoint real visitors on a phone. That gap matters because loading, interaction, and layout stability can fail for different reasons. The figures below keep each measurement separate, so a broad assessment is not mistaken for an INP-only pass rate.
| Measure | Year | Share of sites |
|---|---|---|
| Websites with good overall Core Web Vitals using INP | 2024 | 43%, according to the HTTP Archive Web Almanac |
| Mobile websites passing all three metrics | 2025 | 48%, in HTTP Archive data reported by StatisticsGlobal |
| Mobile pages with good LCP | 2025 | 62%, in HTTP Archive data reported by DigitalTreed |
| Mobile websites with good INP | 2025 | 77%, in HTTP Archive data reported by DigitalTreed |
| Desktop websites with good INP | 2025 | 97%, in the same HTTP Archive findings |
The mobile and desktop INP figures leave a 20-percentage-point gap, based on the linked HTTP Archive findings. That comparison is useful because interaction performance depends on more than how quickly an image downloads. A page can serve its main content at a reasonable pace and still feel slow when someone taps a menu, opens search, or dismisses a dialog.
Mobile has separate loading and interaction constraints
LCP is the weakest mobile metric highlighted by these figures. On phones, 62% of pages have good LCP, while 77% have good INP, so loading is the tighter constraint in this comparison. The selected measurements do not include a CLS pass rate, so this table alone is not a complete ranking of every metric.
Slower phone hardware and limited memory can make JavaScript execution more expensive. Network conditions also influence when resources arrive and when scripts begin competing for the browser's attention. Think of the browser as a small kitchen during a rush. A delivery can arrive on time, yet the meal still waits if too many orders occupy the same chef.
Say an article's hero image appears promptly, but a plugin starts processing a large interface component just as someone opens navigation. The visitor sees the article, taps the menu, and receives no immediate feedback.
Image optimization won't resolve that interaction delay on its own. Inspect plugin scripts, third-party code, and long main-thread tasks separately. Compare your site's mobile LCP and INP status with these benchmarks as context, not as replacement targets. Your task is to meet the experience thresholds, not merely outperform a share of other websites.
How to Fix LCP, INP and CLS on a WordPress Site
Start with the failing metric and a representative template. When both loading and interaction need work, improving the main content's arrival is a sensible starting point, but don't spend time on LCP if your actual failure is layout stability.
Use this workflow to keep measurement, repair, and verification connected.
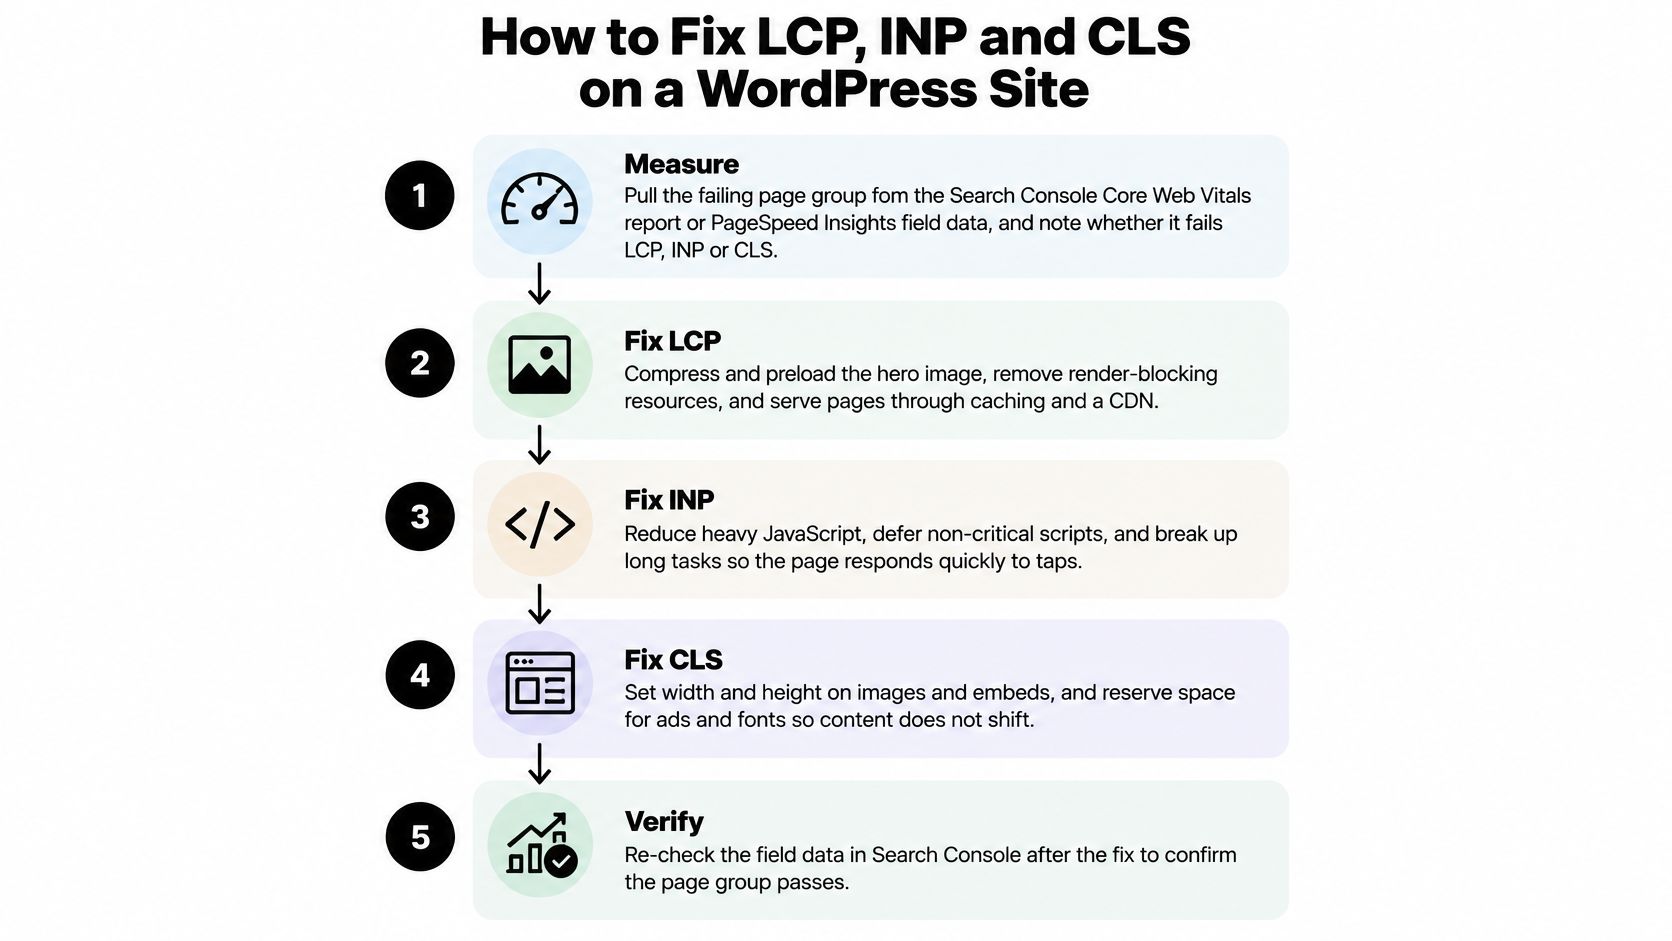
Repair the measured bottleneck
Measure the affected template. Pull the failing page group from Search Console or inspect PageSpeed Insights field data, noting whether mobile fails. Save the representative URL and baseline so your next test answers the same question.
Improve LCP delivery. Compress the hero image, serve an appropriately sized version, and prioritize or preload it when the browser otherwise discovers it late. Avoid lazy-loading the above-the-fold LCP image, remove unnecessary render-blocking resources, and investigate server response time, caching, and CDN delivery because the browser can't render content it hasn't received.
Reduce interaction-blocking work. Deactivate or replace plugins that load unnecessary scripts site-wide, and defer nonessential analytics or advertising work where appropriate. Have a developer break long JavaScript tasks into smaller pieces so the browser can process input and render feedback between them.
Reserve layout space. Add image dimensions, provide stable embed containers, and allocate space for advertisements and banners before they arrive. Review font fallbacks too, because changed text dimensions can move surrounding content.
Verify under matching conditions. Re-test the same template in the lab, then monitor its field assessment as new visitor measurements arrive. Record each change and its date, and avoid combining unrelated template changes when you need to establish what helped.
| Symptom | Likely cause to investigate | Practical repair |
|---|---|---|
| Main image appears late | Large file or late discovery | Resize, compress, prioritize |
| Menu ignores a tap | Main thread occupied by scripts | Reduce JavaScript and split tasks |
| Article text jumps | Missing space for incoming content | Reserve dimensions or aspect ratio |
Check the surrounding mobile experience
A responsive layout can still be slow, and a fast page can still be awkward to use. Pair performance work with this guide to making a WordPress blog mobile-friendly so navigation and reading remain usable.
For an additional implementation reference, AISEOGrow on passing vitals assessments can help you organize optimization work around the assessment rather than a single score.
Use the accompanying video as a visual supplement while checking your own template.

This video is hosted by YouTube (Google). Pressing play loads the video from YouTube, which may set cookies and share data with Google.
Keep changes reversible. Test plugin and script changes on staging, especially when they affect consent controls, forms, or advertising.
Check Each Template Against All Three Thresholds
Treat a failing mobile template as a release problem, not something to revisit after publishing more posts. Before a major update goes live, test its representative pages; after release, confirm that real-user measurements support the result.
Use Google Search Console to inspect mobile page groups, then check the relevant interactions yourself. A passing homepage doesn't establish that post pages or archives perform well.
A practical release checklist
- Loading: Confirm that the main article's LCP meets the good threshold and that the intended hero image isn't delayed unnecessarily.
- Responsiveness: Test navigation and search, then confirm INP meets the good threshold in field measurements.
- Stability: Load images, advertisements, and banners while watching for movement, and verify that CLS remains in the good band.
- Field confirmation: Look for the affected group to receive a good assessment, rather than relying only on a strong lab score.
For a new template without sufficient visitor measurements, use lab testing as a provisional release check and continue monitoring after launch. Don't describe an unmeasured template as having passed a field assessment.
Our third-party partners at Read More Information are Google (AdSense, Analytics, Search Console, Site Kit), YouTube for embedded videos, and our hosting provider. That makes checking third-party behavior part of maintaining the reading experience, not just reviewing theme files.
Combine these checks with responsive design testing on representative homepage, archive, and post layouts. If a check fails, repair that template before adding more content that inherits the same problem.
Read More Info publishes practical WordPress and web guidance, including explanations of performance, responsive design, search, and RSS. Visit Read More Info to choose your next improvement, then test a representative mobile article page and record the metric you'll fix first.